Packing and Cracking: Virtual
Cue System for Browser-Based Performance
WHAT
Participatory, civics-education performance
WHEN
September, October 2020
MY ROLE
UI Design
Front-End Development in HTML/CSS/Javascript
'Board Op'
TEAM
Joseph Amodei
Rachel Gita Karp
Rory Kulz
OVERVIEW
What is Packing and Cracking?
"Do we choose our politicians, or do our politicians choose us?
Packing and Cracking is an interactive mapmaking event about gerrymandering: the pervasive practice of politicians choosing their voters rather than the other way around.
Through participatory drawing and map-drawing games, Packing and Cracking uses critical cartography, gerrymandering history, and interviews with politicians and reformers today to show how easy and disenfranchising gerrymandering can be and ask what, if anything, we should do about it."
- from the online documentation of the performance
PRODUCT
A Browser-Based Game Page
For the online performances of Packing and Cracking, I helped develop a browser-based cue system and a collaborative drawing app.
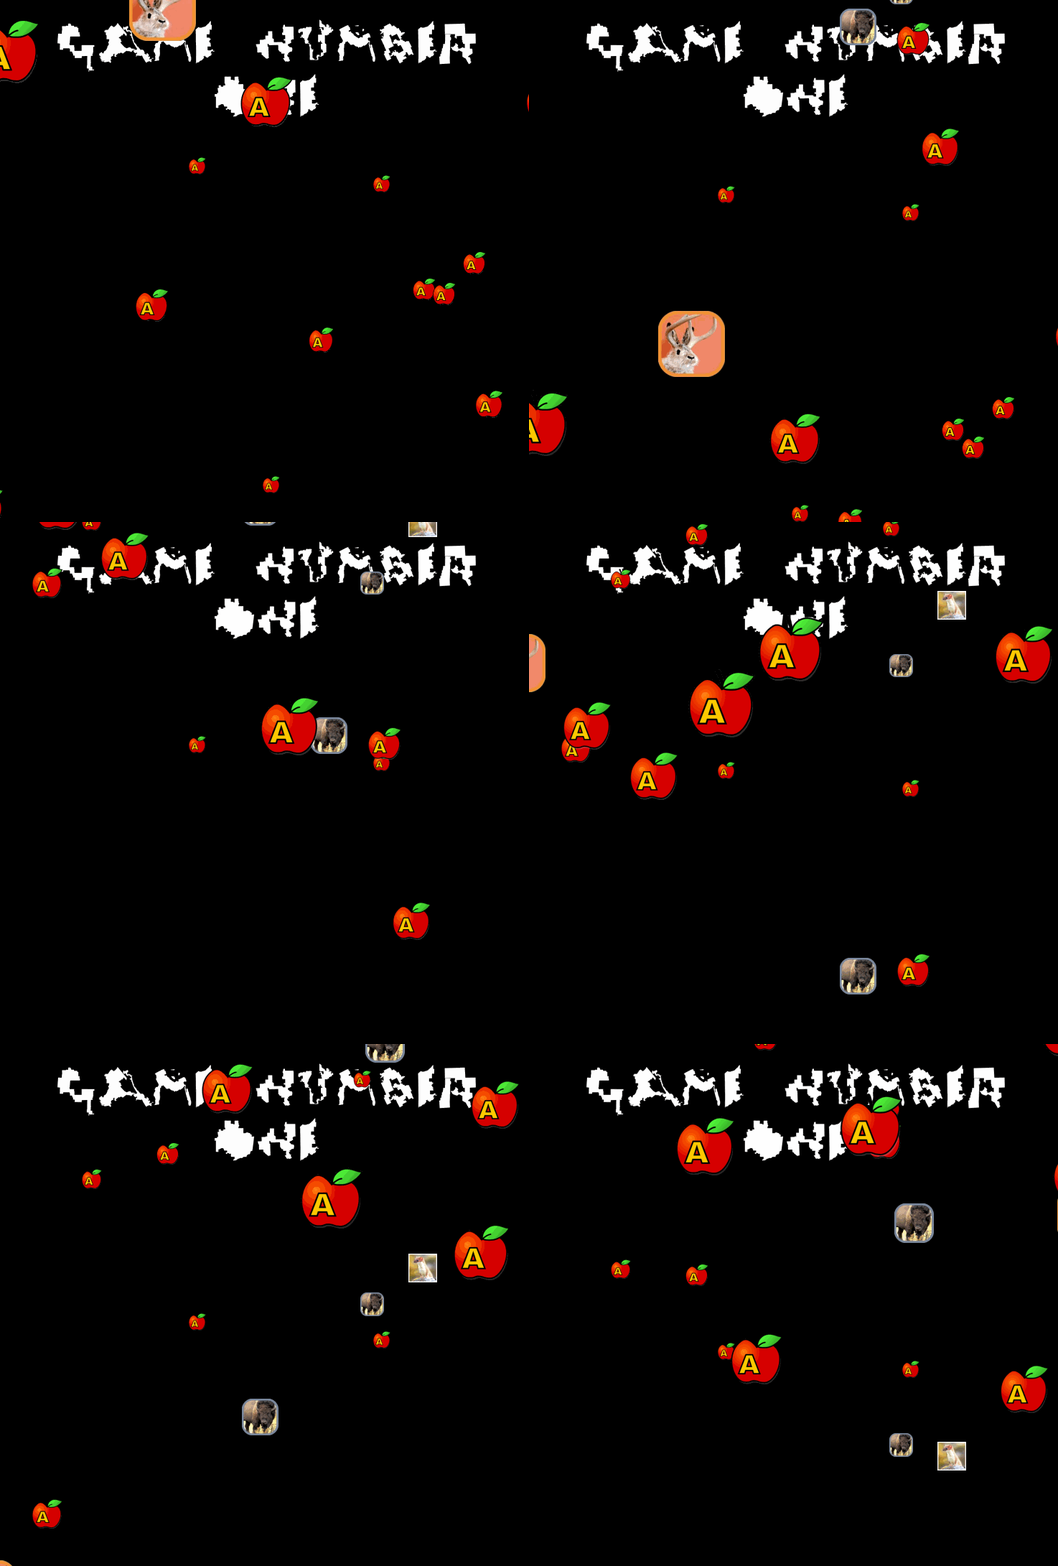
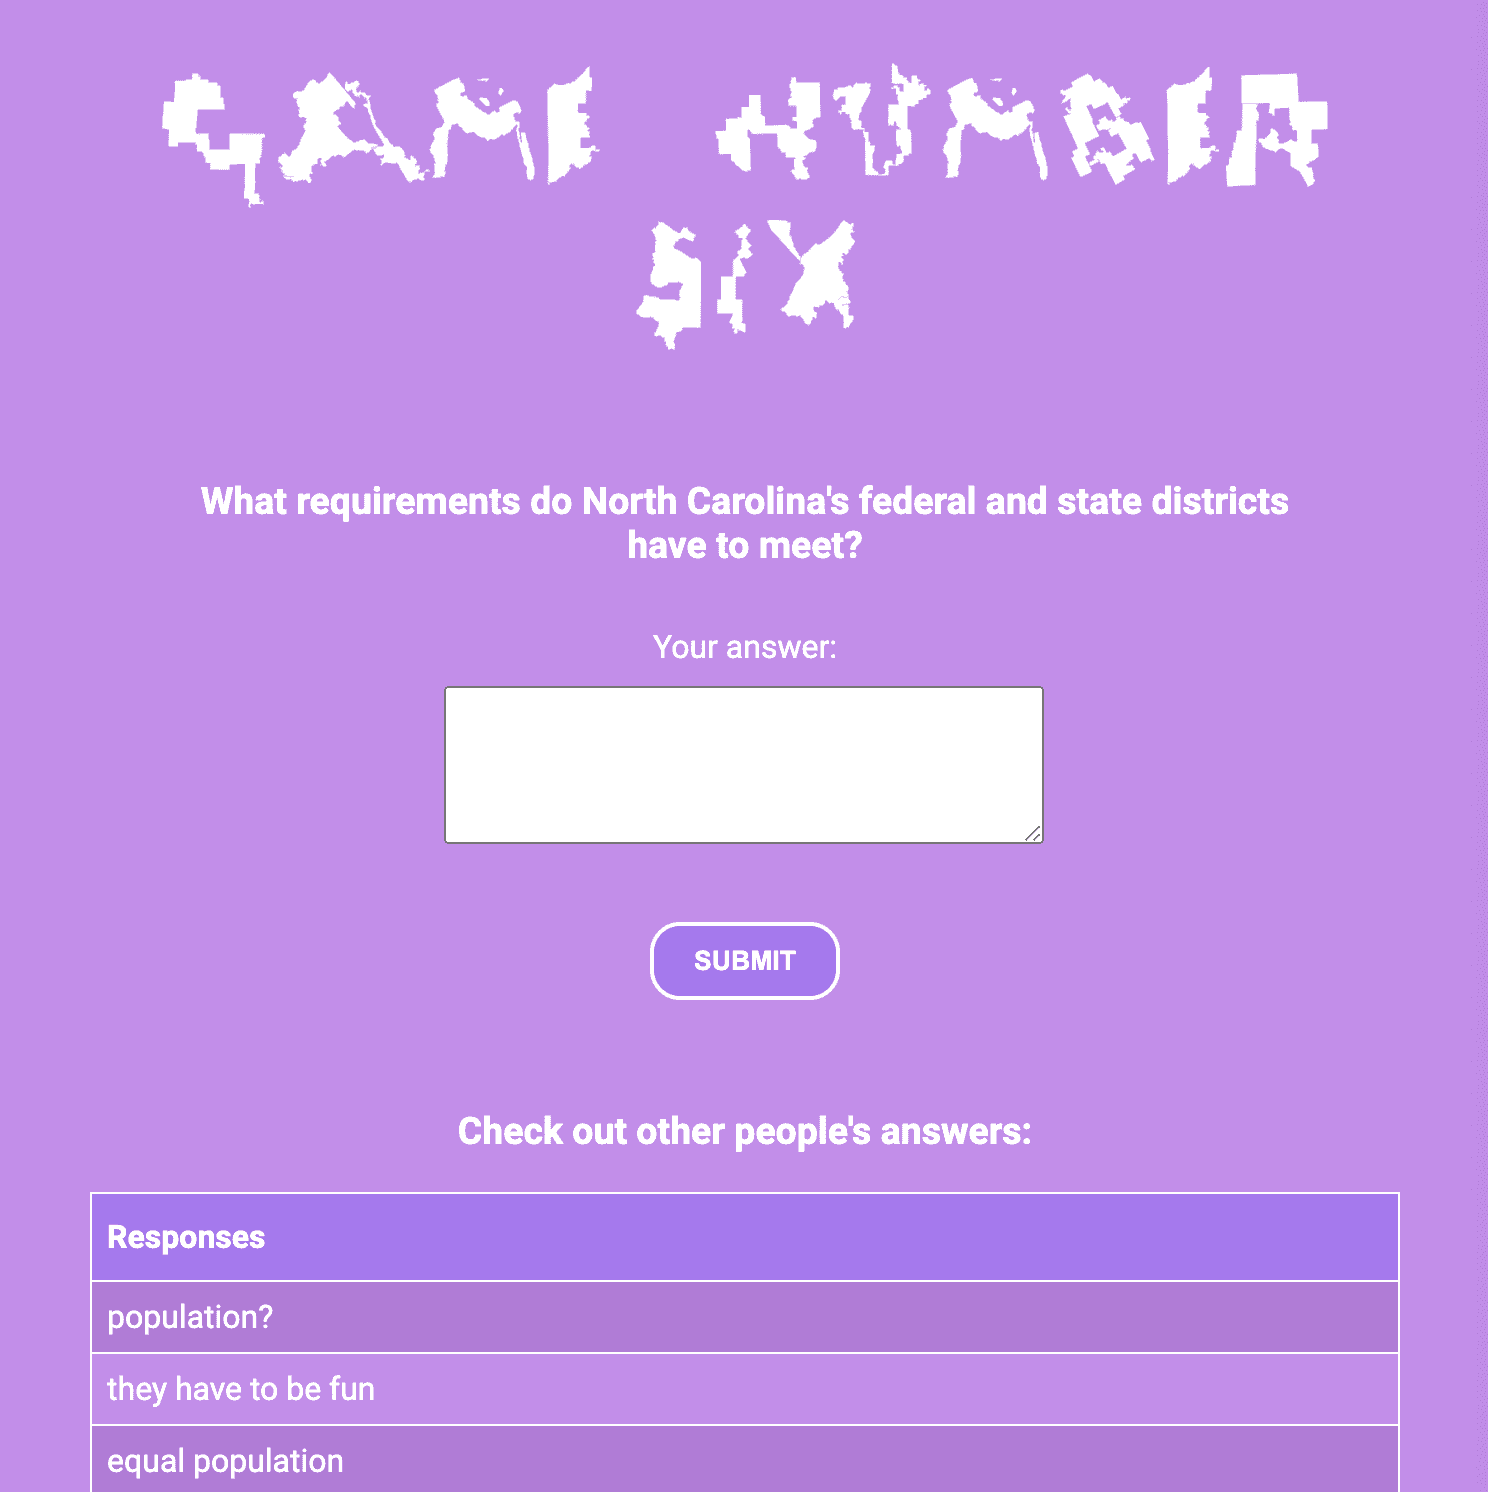
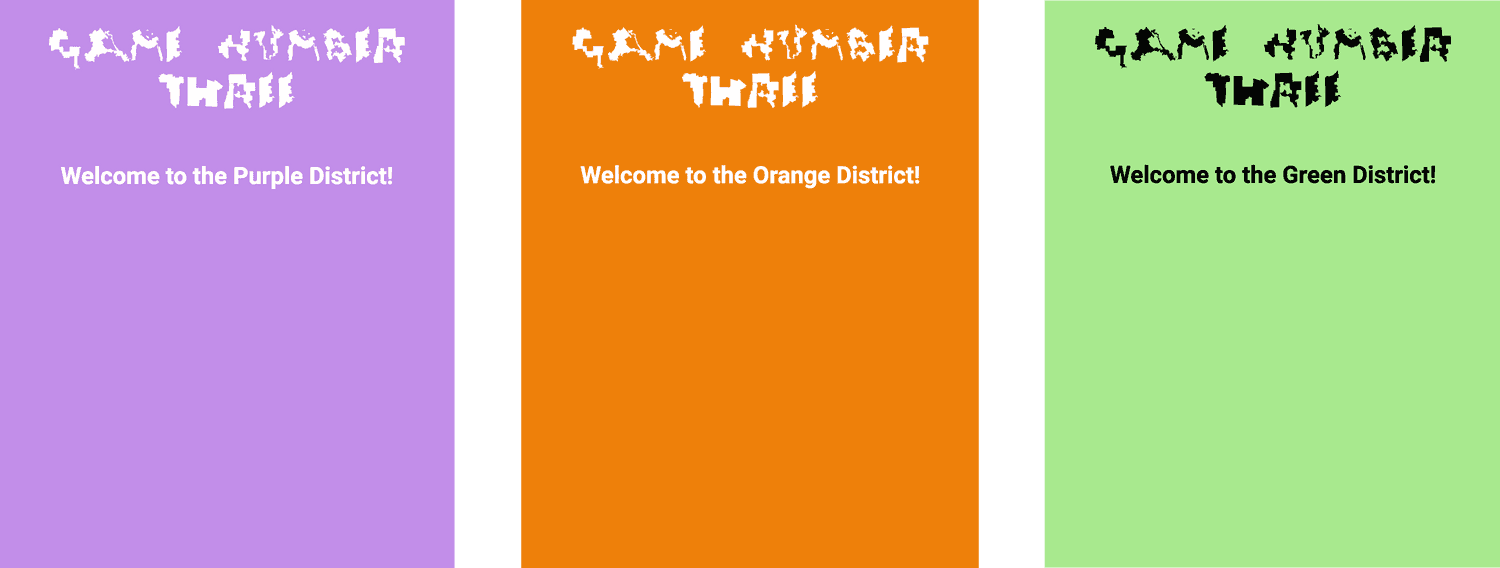
We defined and triggered changes to a custom "game page" that audience members viewed alongside the performance in Zoom.
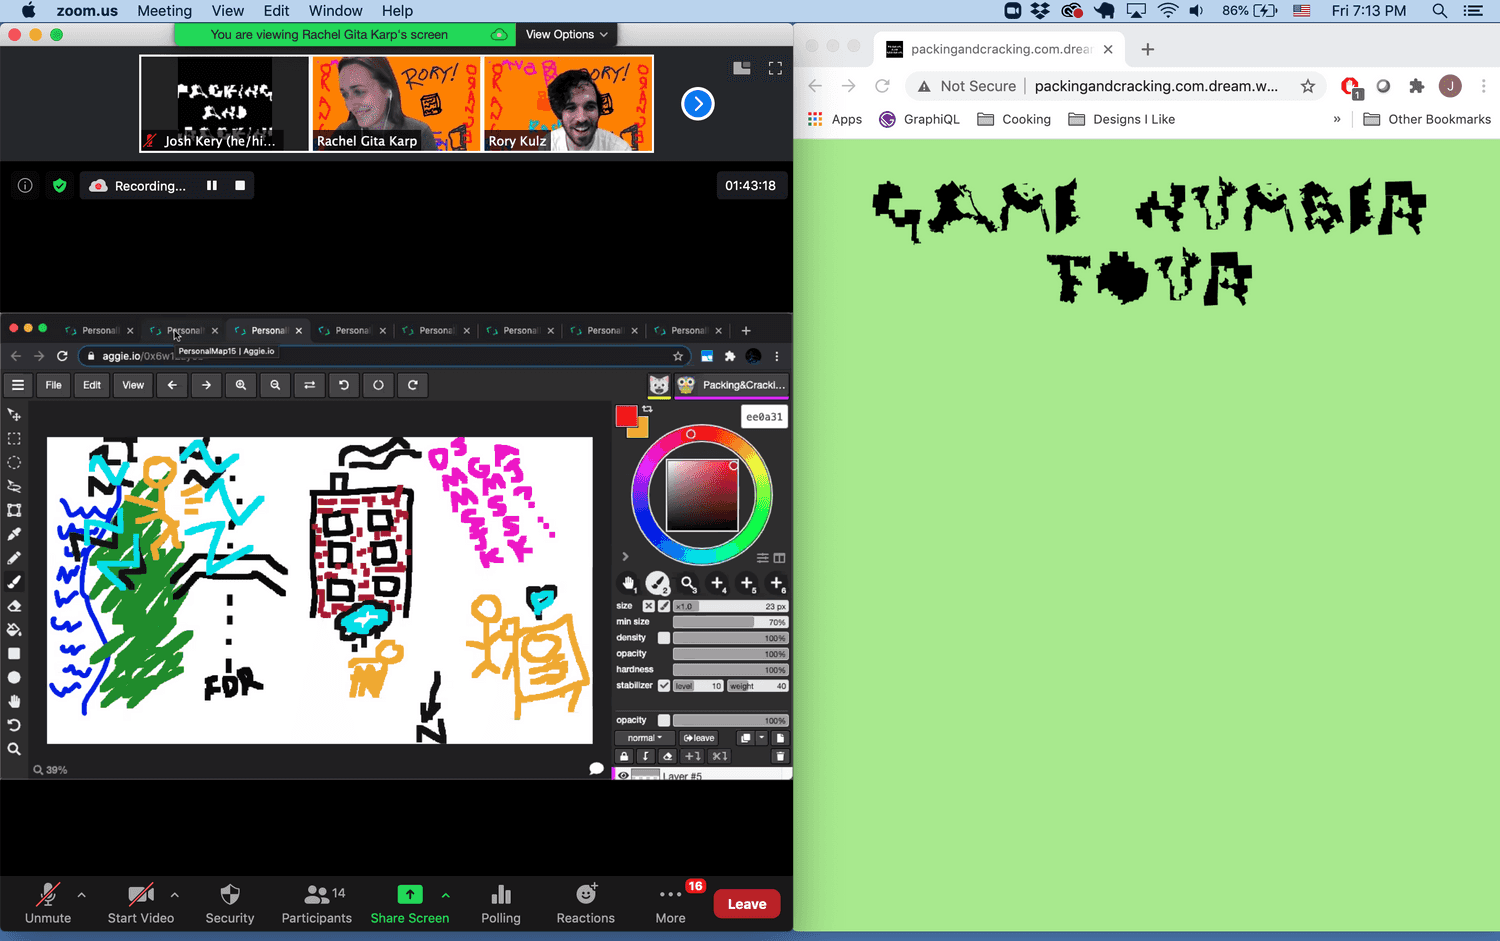
This custom software was used in Packing and Cracking's presentation through the Philadelphia Fringe Festival in September 2020, and through University of North Carolina-Chapel Hill’s Process Series in October 2020.
DOCUMENTATION
Watch the full-length documentation of Packing and Cracking at University of North Carolina-Chapel Hill’s Process Series, October 2020:
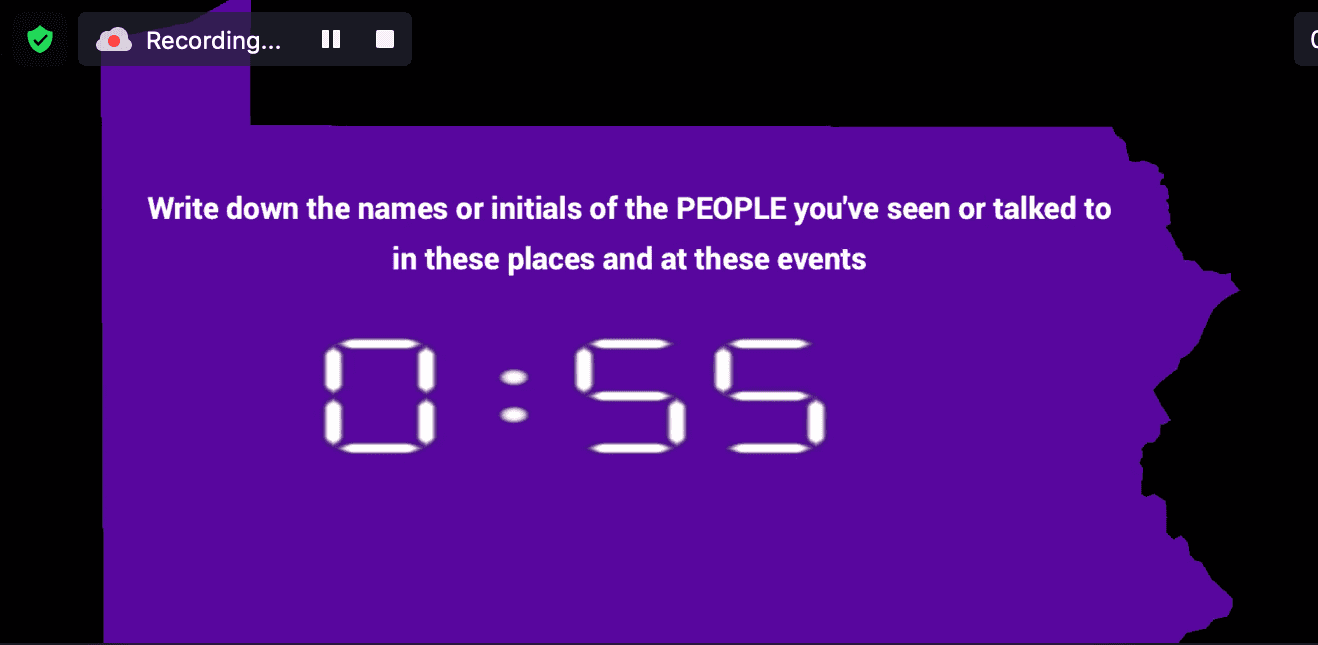
In the event, audiences participated in a series of interactive games, where they drew, responded to quizzes, explored maps, and watched interviews with local politicans and activists talking about gerrymandering.
COLLABORATIVE DRAWING TOOLS
A Show About Maps
Audience members draw personal maps at the beginning of the performance:
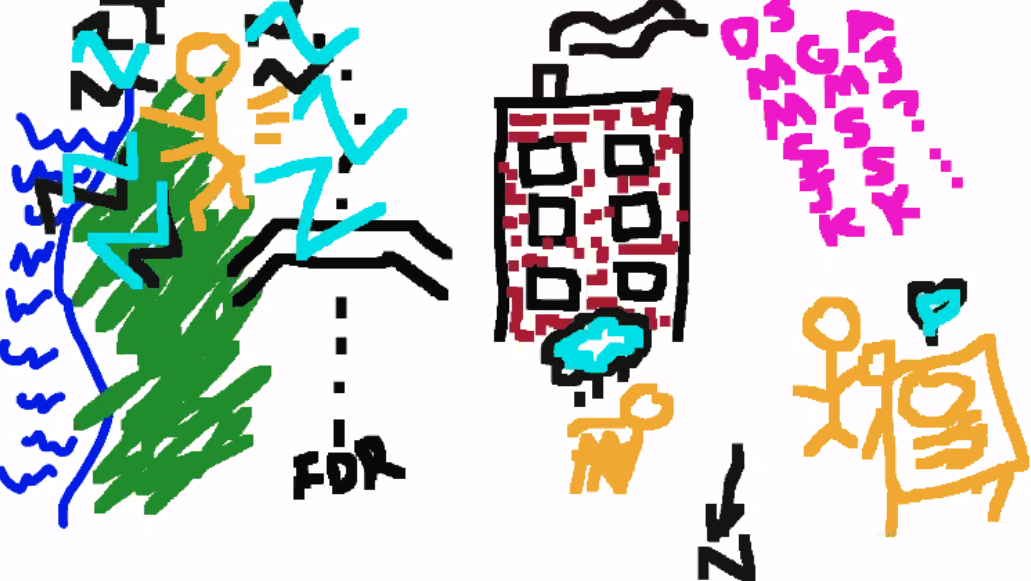
These personal maps help challenge the authority of the maps we see all around us.
A Custom Drawing Tool
For the October performance, I developed a drawing tool with glitch.me to reduce the learning curve for drawing online:
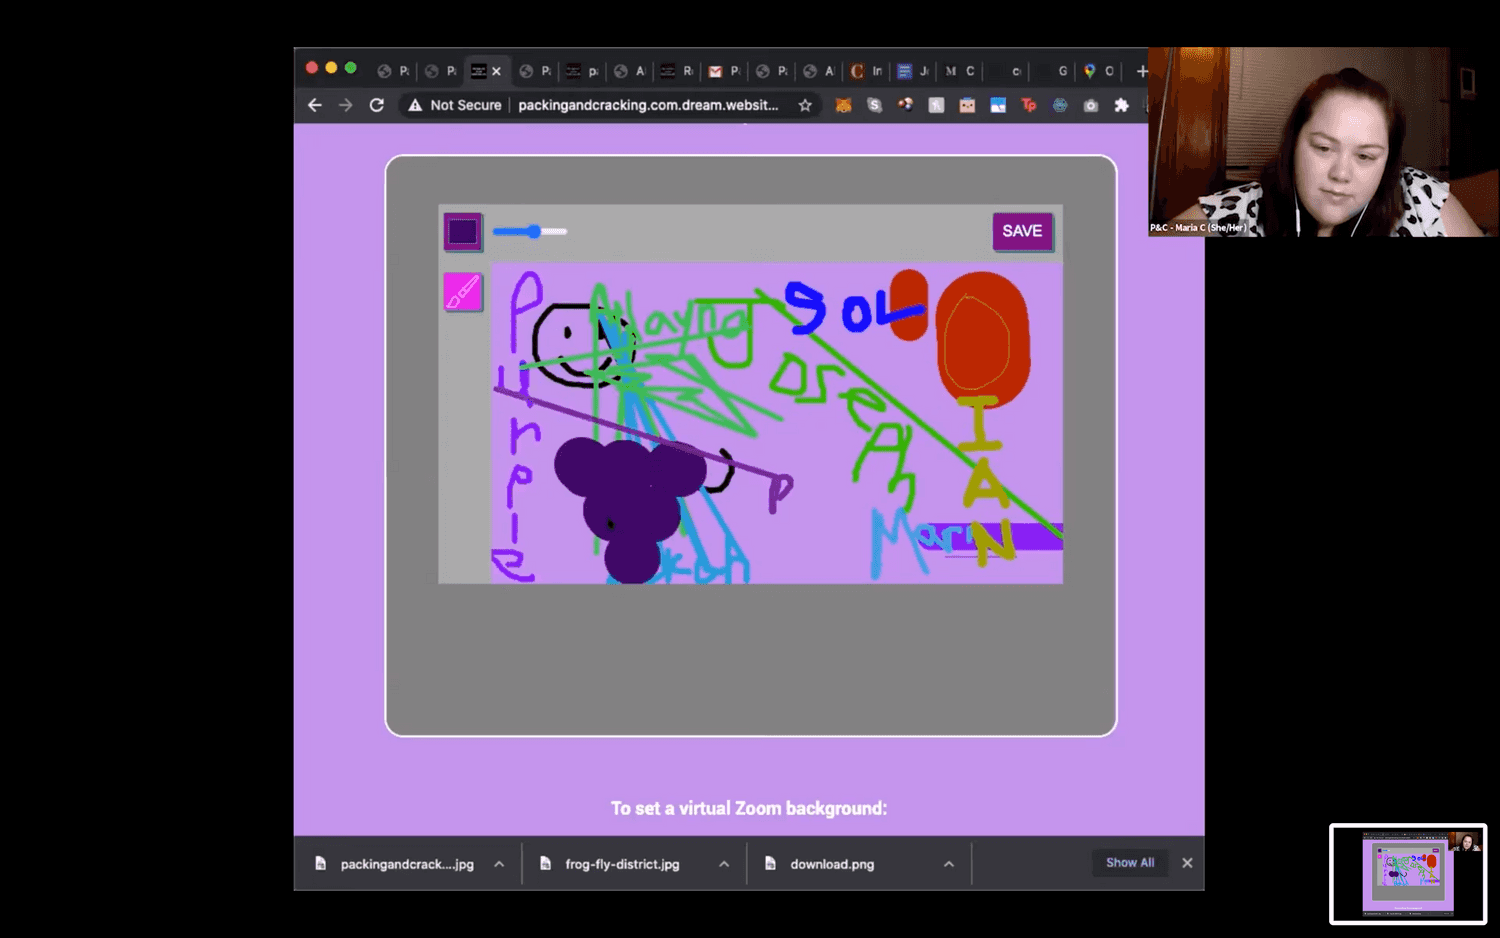
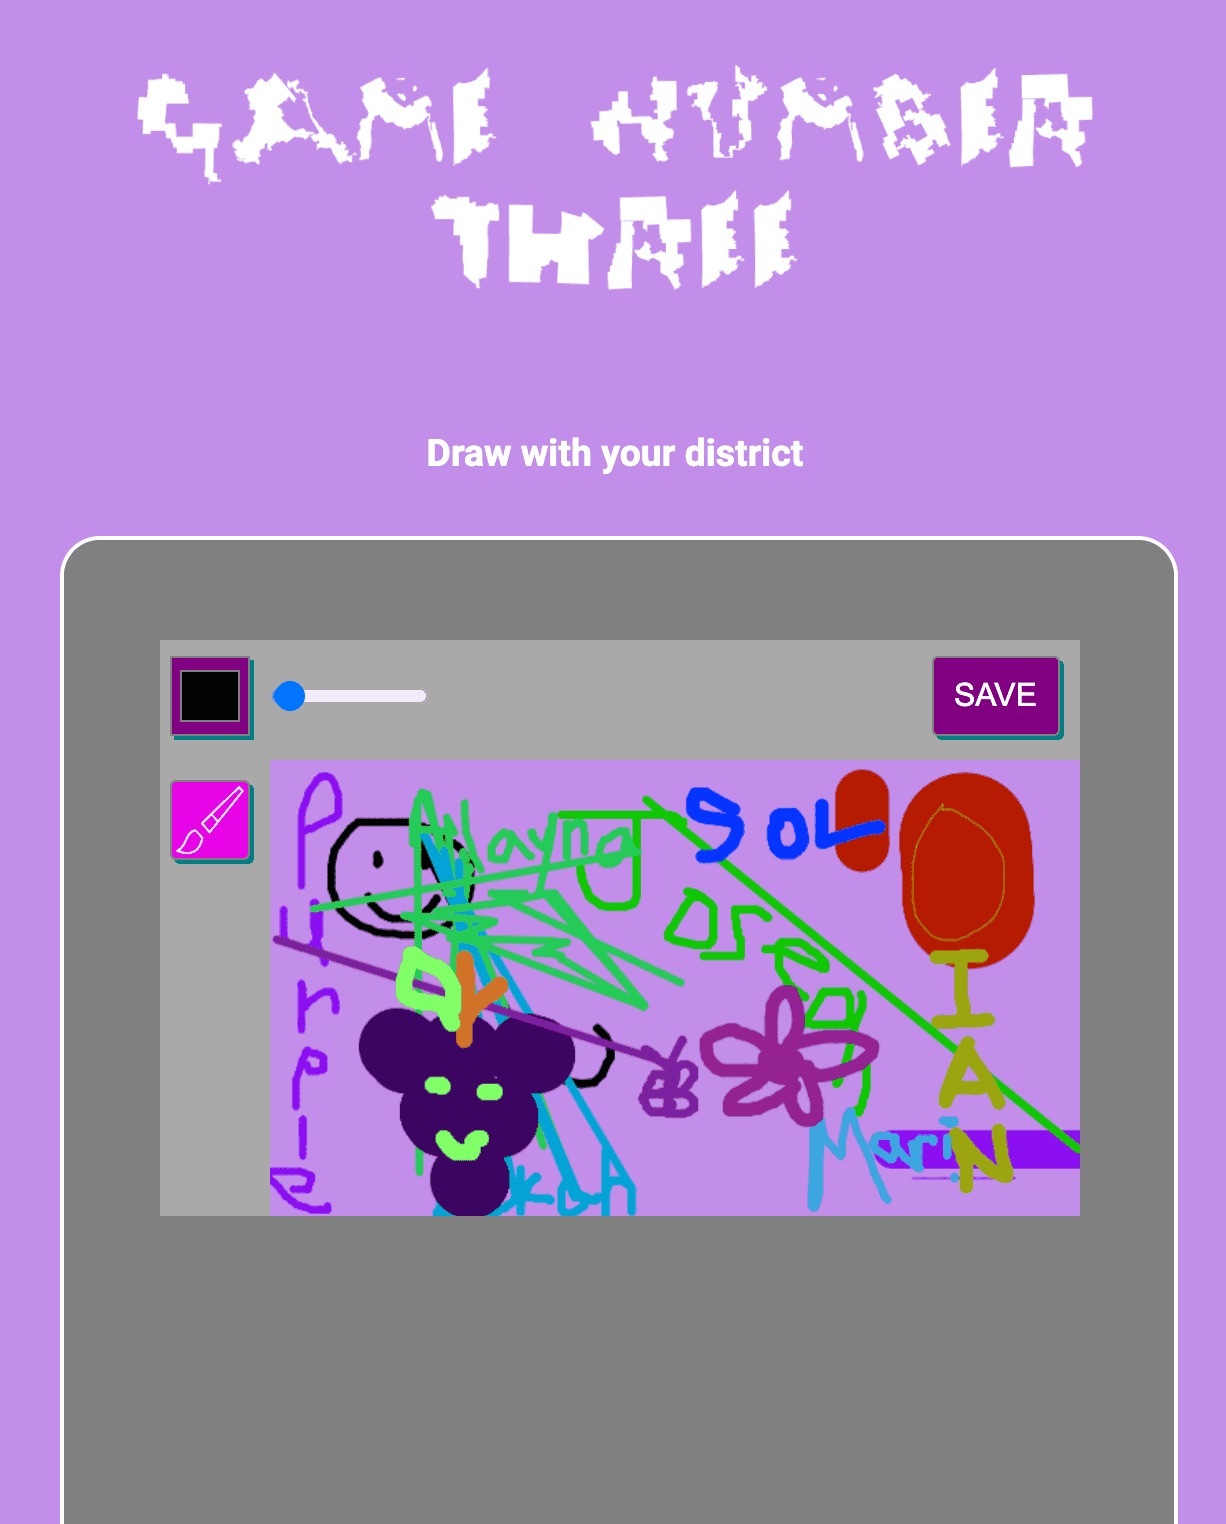
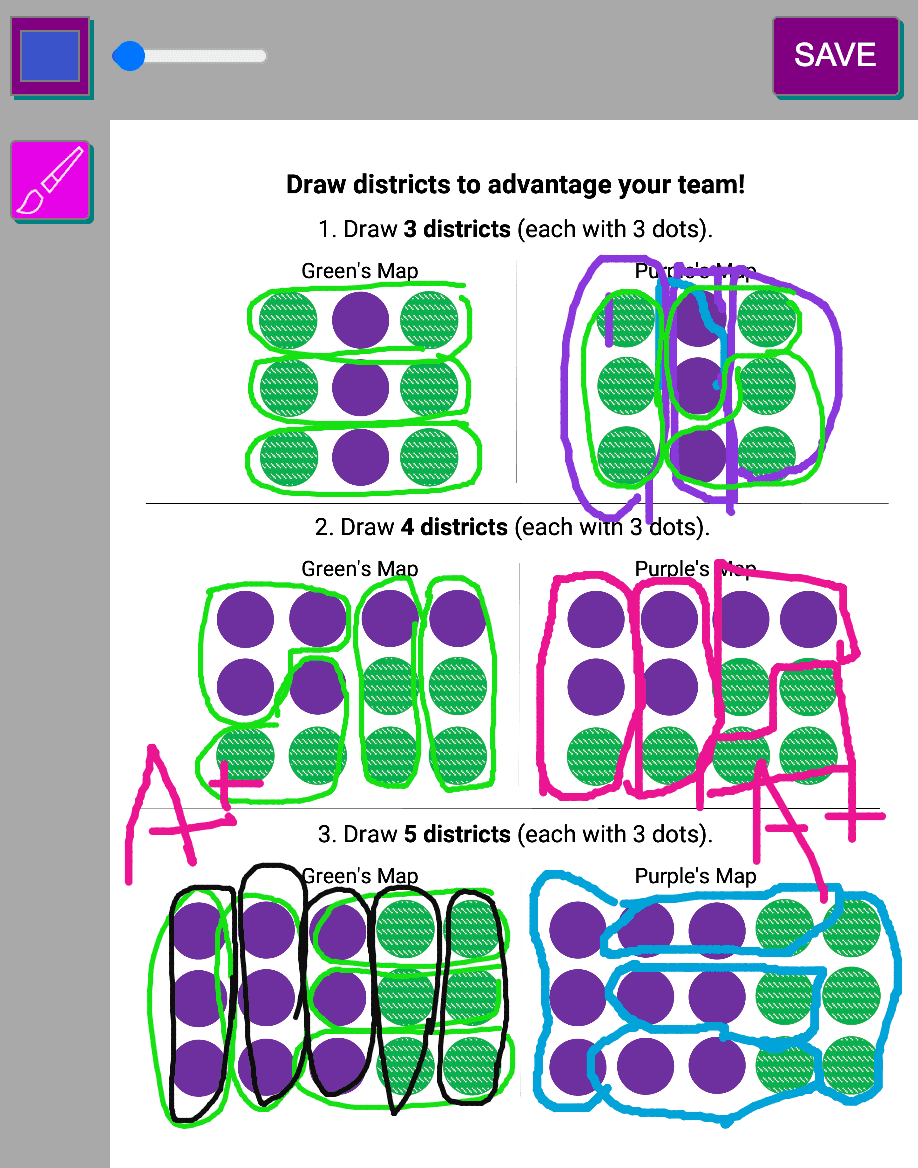
I adapted the drawing tool for its three uses in the performance:
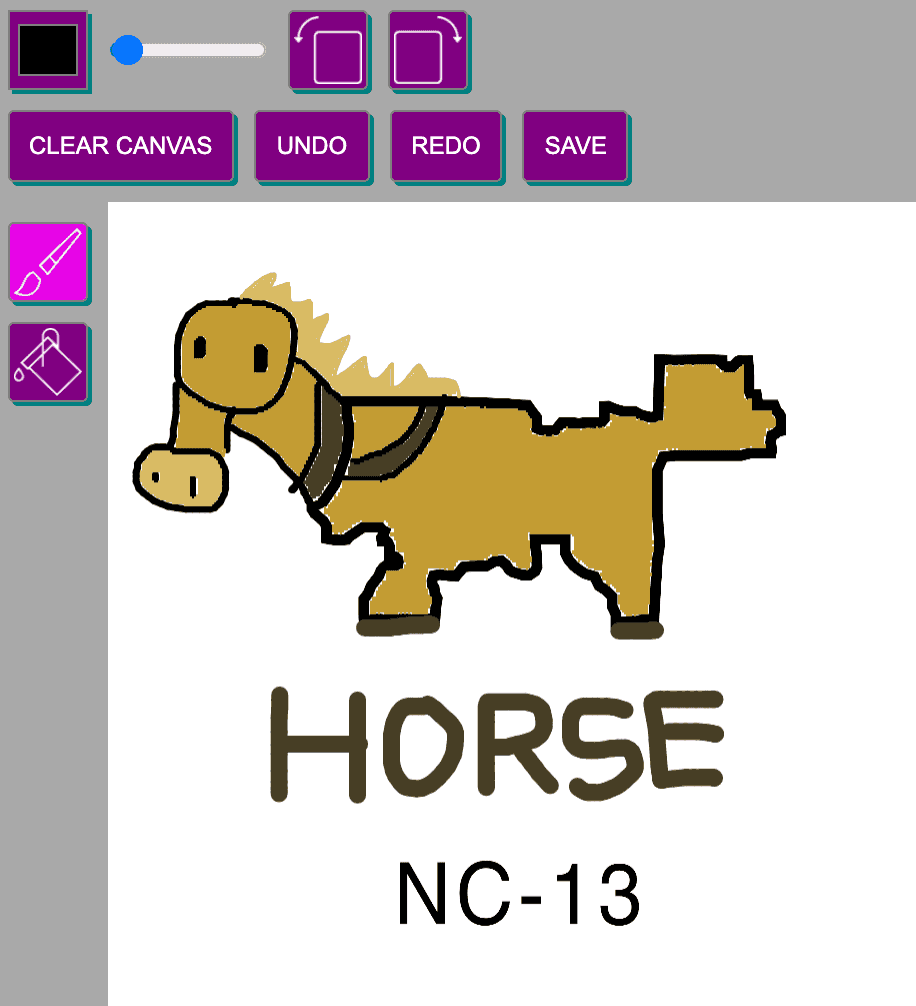
And Game 9, in which audience members draw what they think the heavily gerrymandered districts of their state look like.
Using our own platform allowed us to more easily gather audience members' drawings to share back out with them throughout the performance.
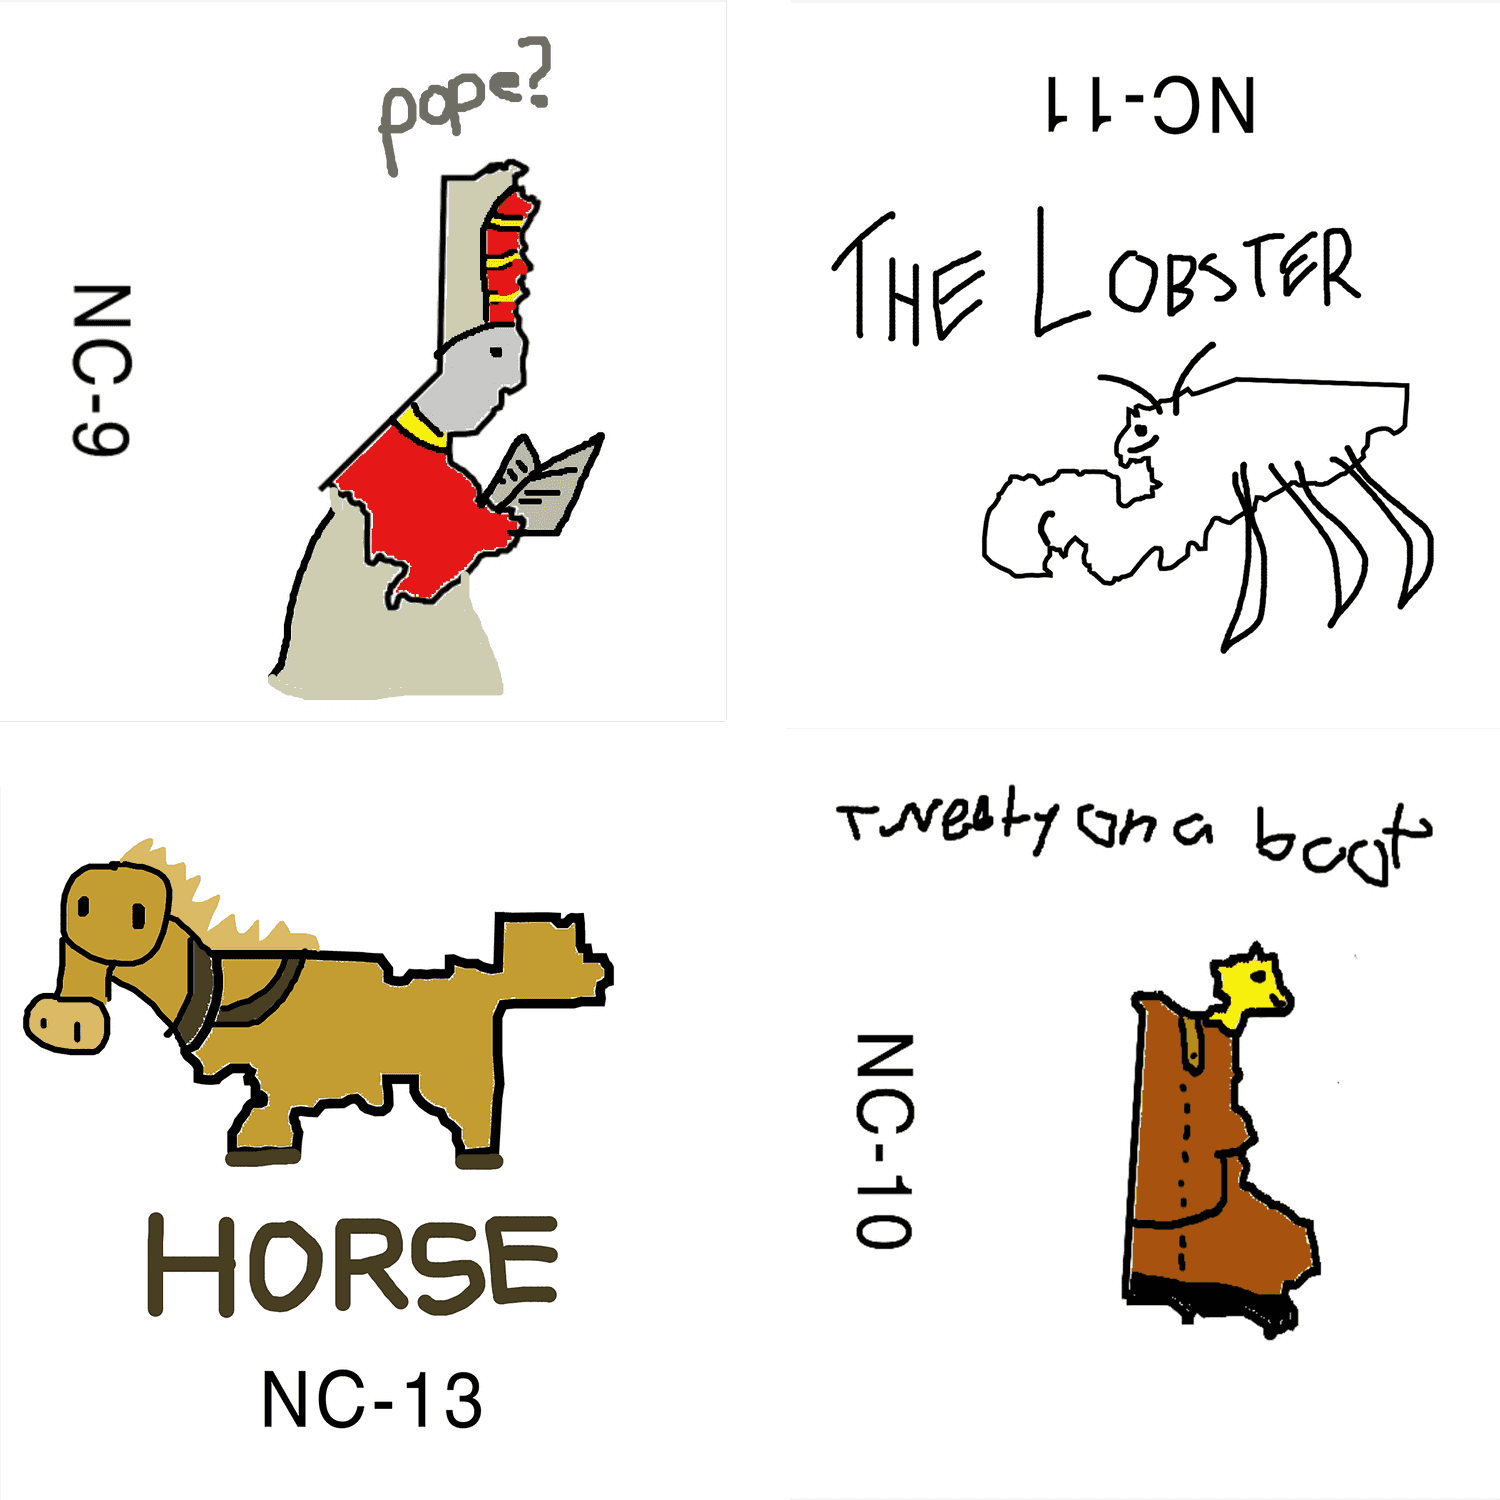
The drawings below come from Game 9, when facilitators and audience members draw on top of the heavily gerrymandered districts in their state.
TECHNOLOGY USED
Maps APIs
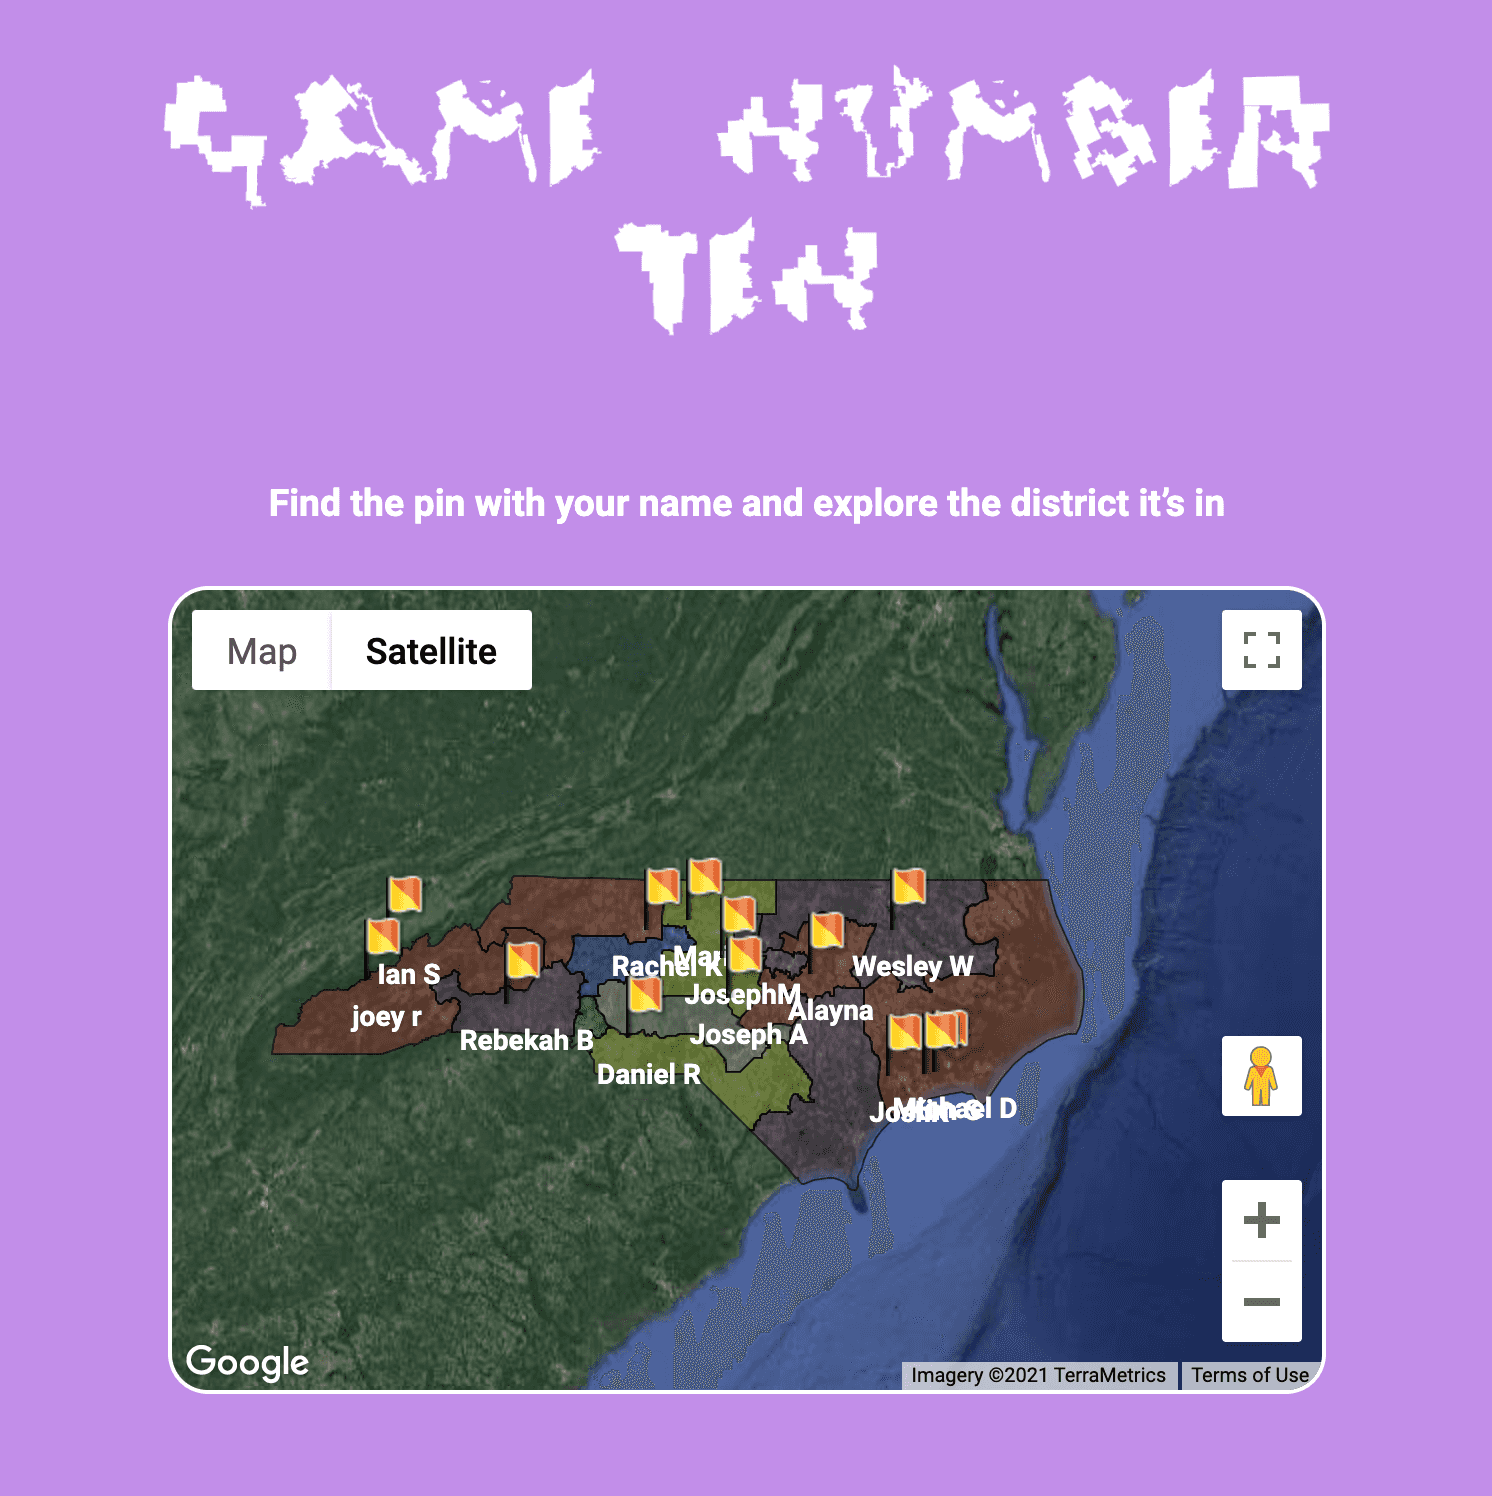
Audience members explored maps through our use of the Google Maps API and Mapbox.
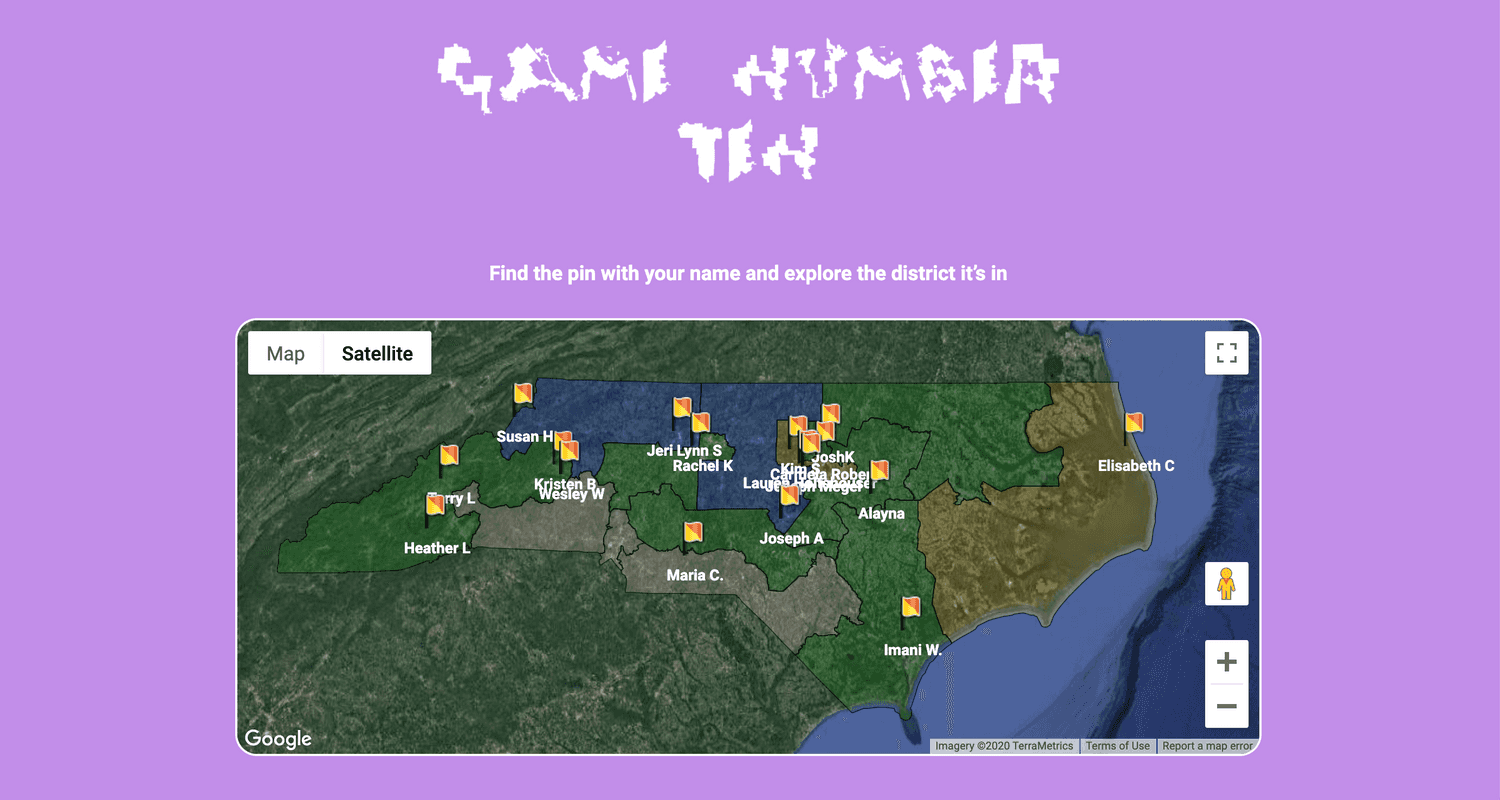
Above, audience members submitted locations of their choice that we geocoded and plotted on a map of North Carolina's congressional districts, highlighting the hidden ways these district lines split up the state.
We incorporated both the Google Maps API and Mapbox SDK into the performance.
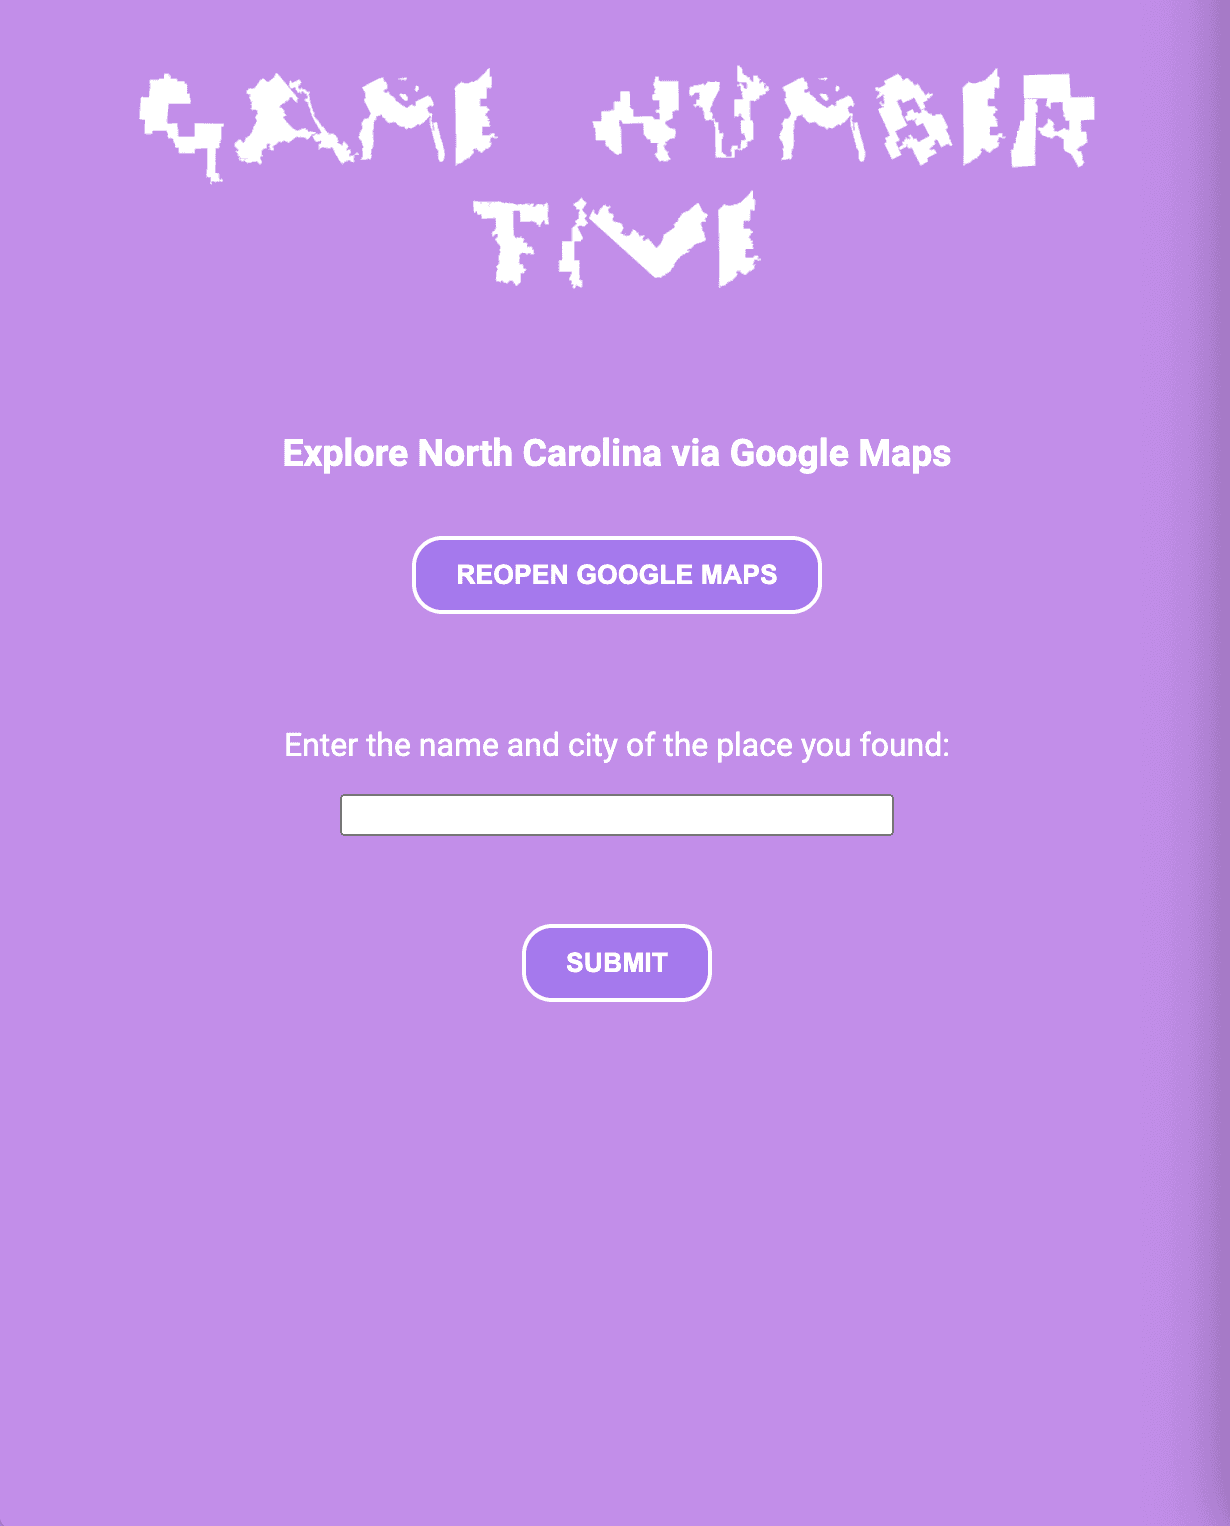
Audience members submitted their locations for the above map in Game 5. On the back-end, we used the Google APIs to do the geocoding and plotting.
In Game 12, we used Mapbox to let audience members explore the current U.S. Congressional Districts.
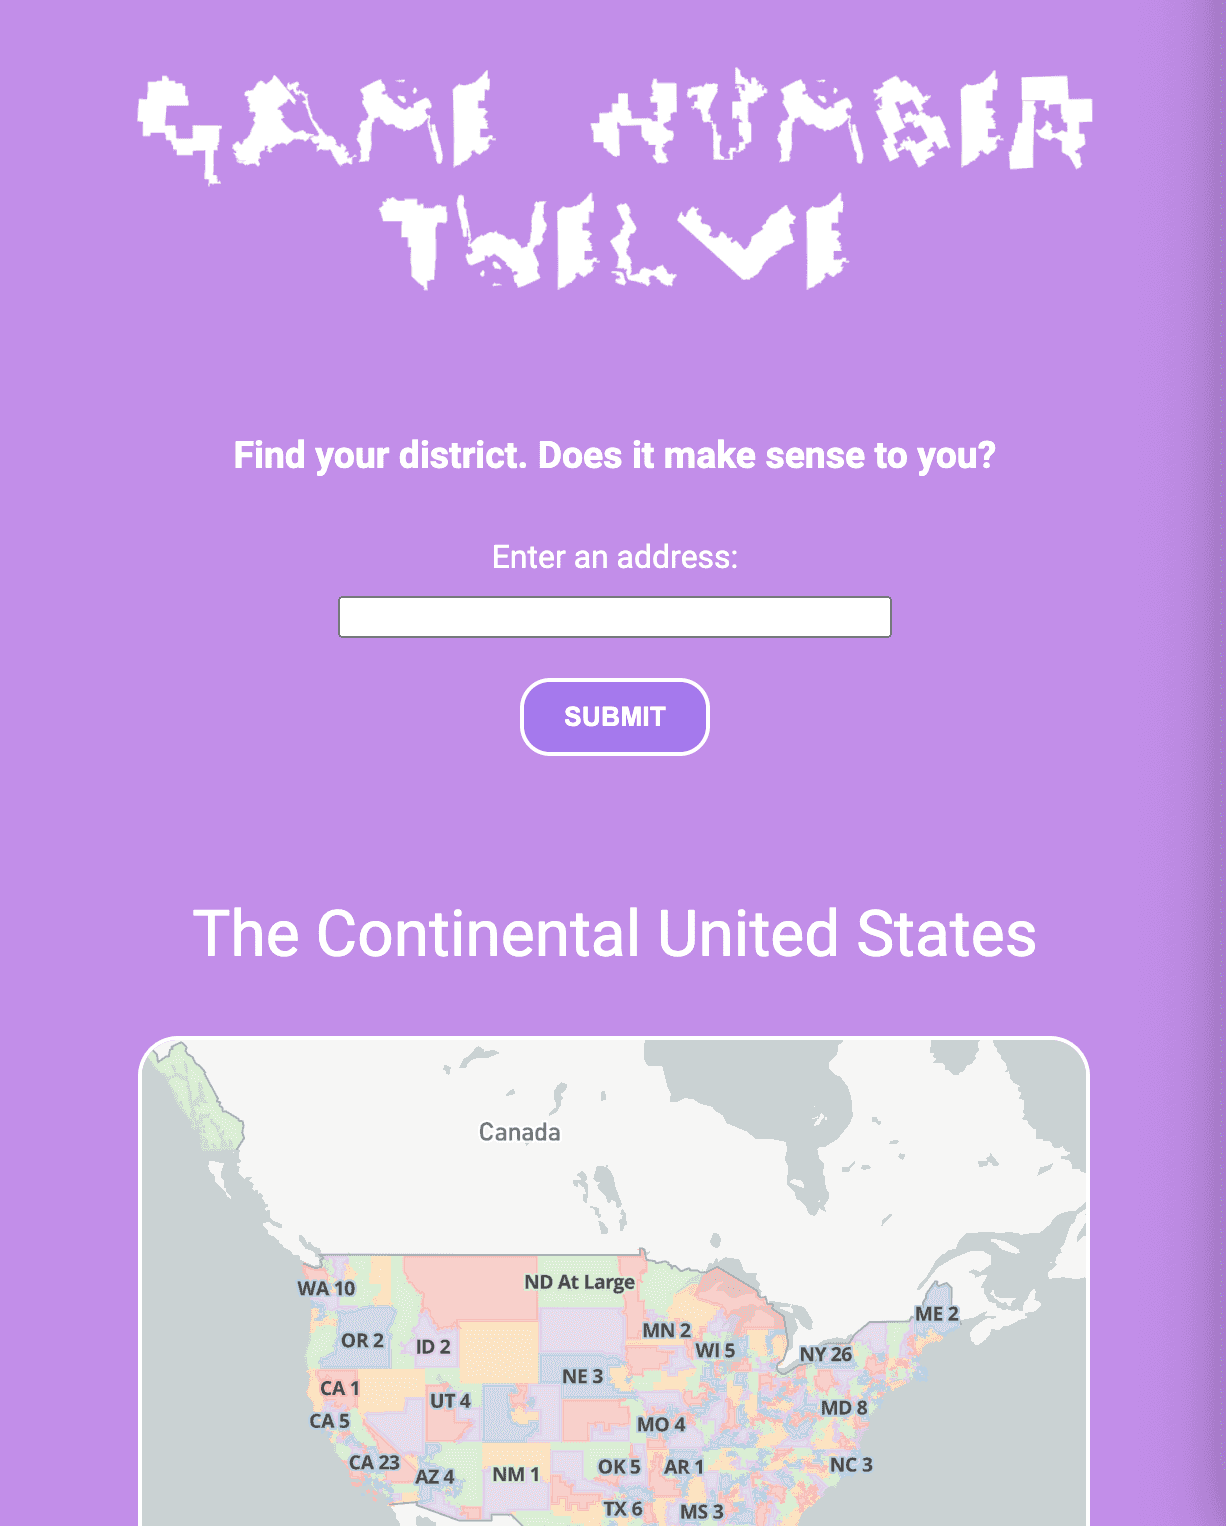
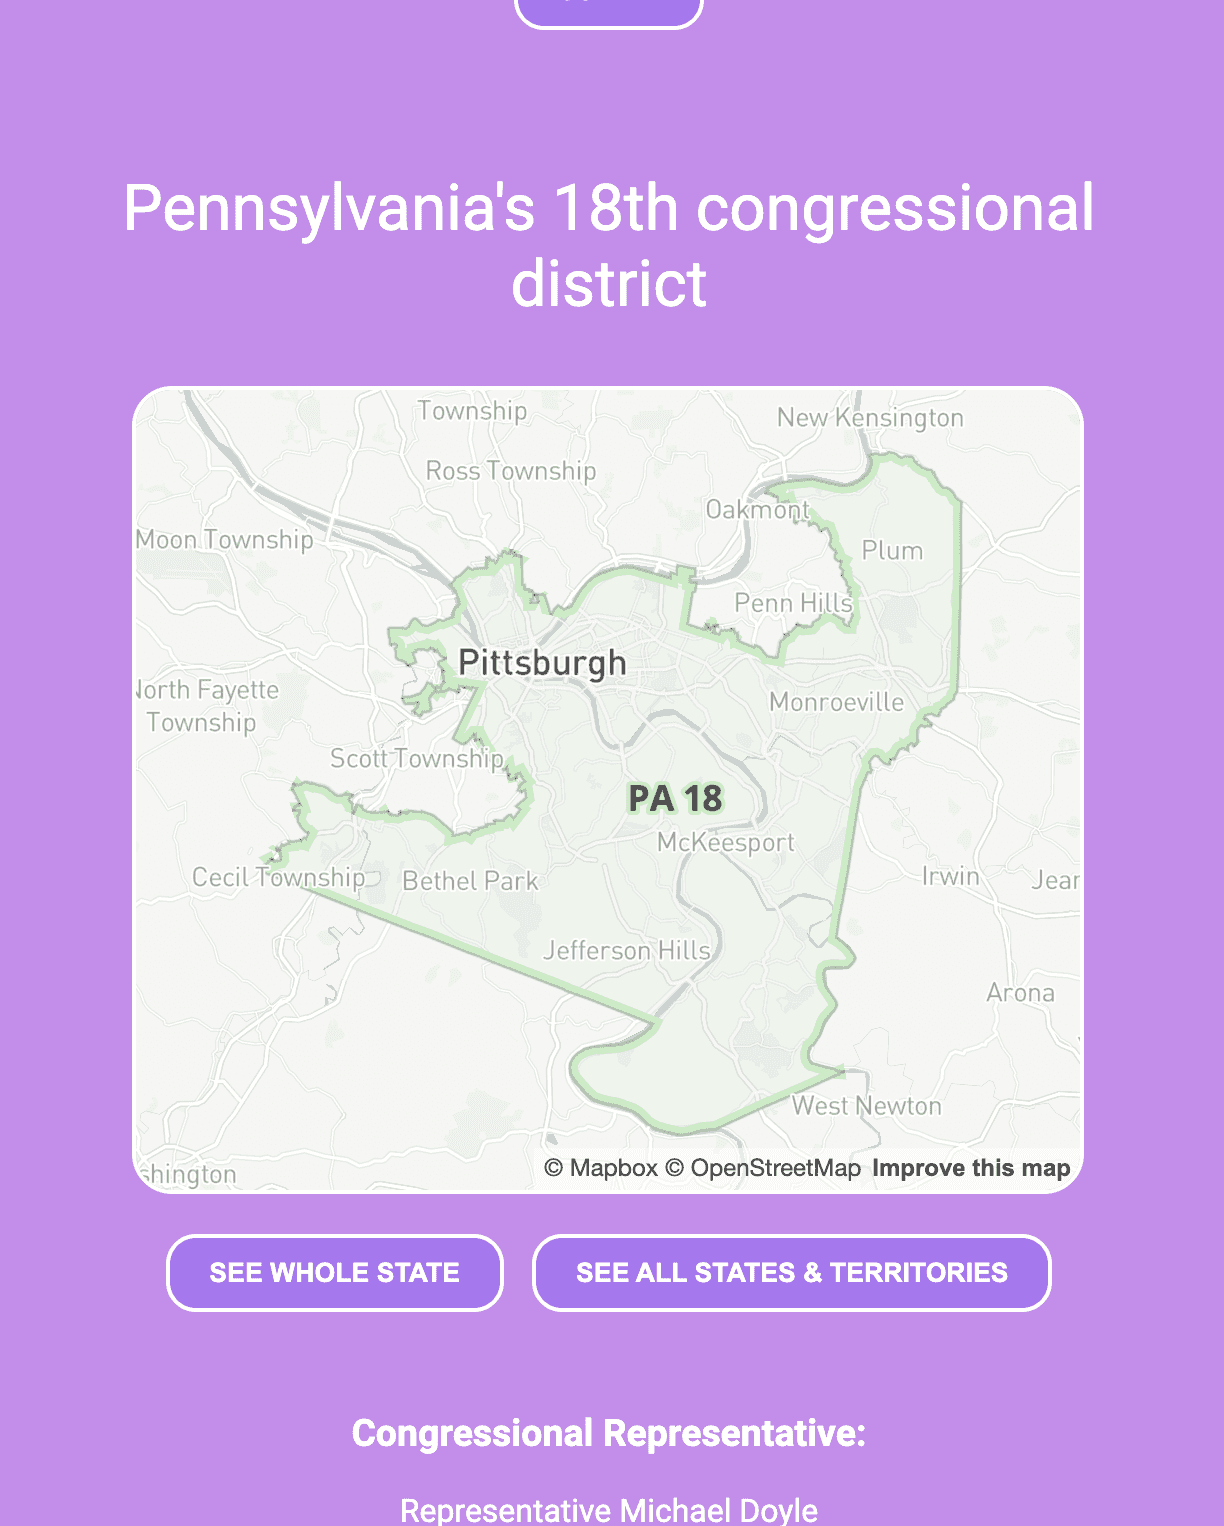
On the back-end, we used the Google Civics API to get the Congressional District of any user-submitted address, and the name of the representative:
TECHNOLOGY DEVELOPED
Theatrical Cue System
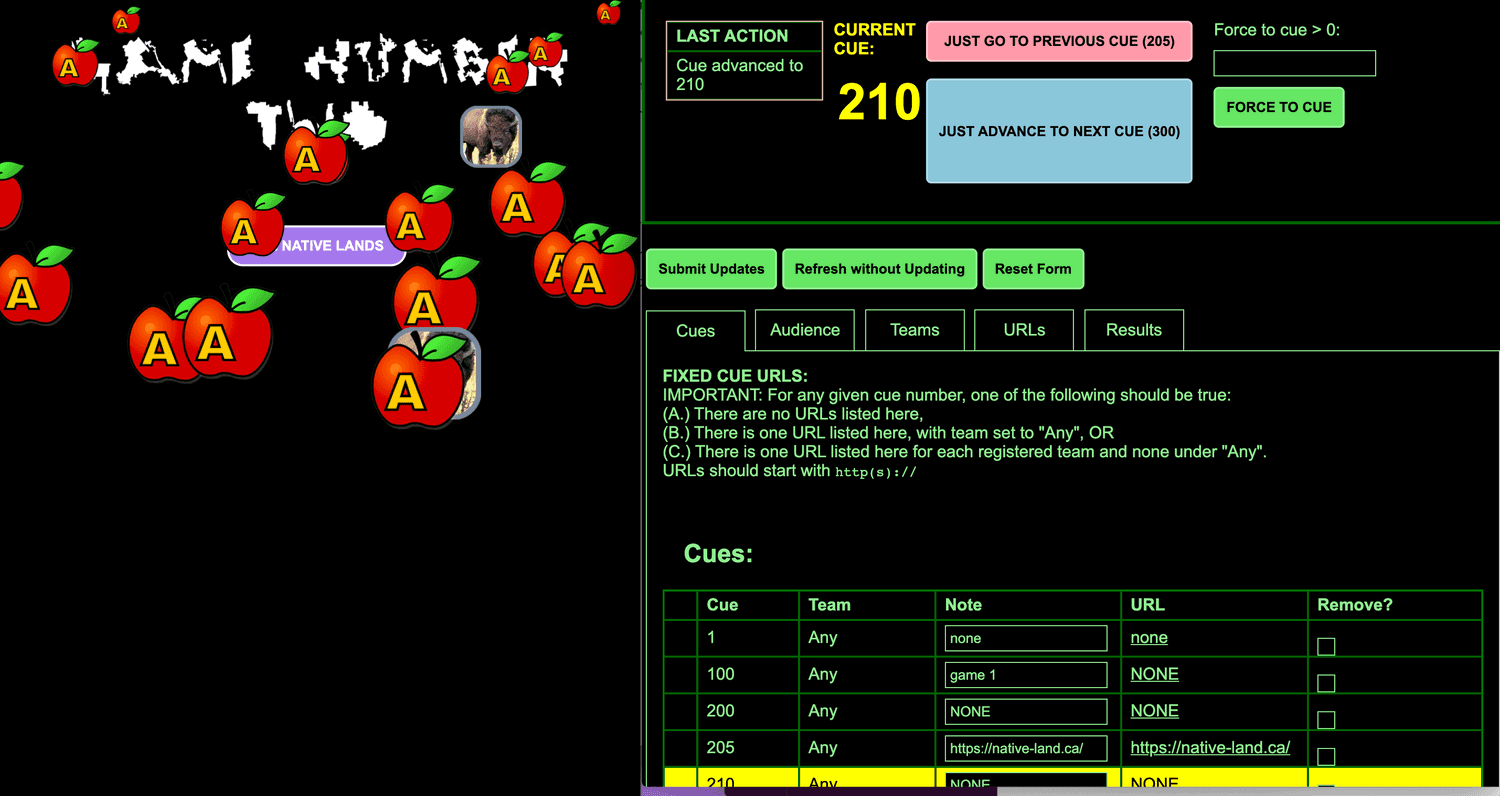
The custom webpage was controlled by a cue system that we developed in PHP and Javascript.
A "board-op" moved the performance through its pre-defined cues using a webpage side by side with the virtual performance:
Assigning audience members into groups increases their motivation to participate and to learn from the performance.
As such, we developed the admin page to allow us to assign them to different teams:
This system let us better curate our audience's attention and improve the performance's accessibility.
